- en
- fr
This is an old revision of the document!
Table of Contents
Forwarding performance lab of a HP ProLiant DL360p Gen8 with 10-Gigabit Chelsio T540-CR
Forwarding performance lab of a quad cores Xeon 2.13GHz and quad-port 10-Gigabit Chelsio T540-CR
Bench lab
Hardware detail
This lab will test an HP ProLiant DL360p Gen8 with eight cores (Intel Xeon E5-2650 @ 2.60GHz), quad port Chelsio 10-Gigabit T540-CR and OPT SFP (SFP-10G-LR).
The lab is detailed here: Setting up a forwarding performance benchmark lab.
Diagram
+------------------------------------------+ +-------+ +------------------------------+
|        Device under test                 | |Juniper| | Packet generator & receiver  |
|                                          | |  QFX  | |                              |
|                cxl0: 198.18.0.10/24      |=|   <   |=| vcxl0: 198.18.0.108/24       |
|                      2001:2::10/64       | |       | |        2001:2::108/64        |
|                      (00:07:43:2e:e4:70) | |       | |        (00:07:43:2e:e5:92)   |
|                                          | |       | |                              |
|                cxl1: 198.19.0.10/24      |=|   >   |=| vcxl1: 198.19.0.108/24       |
|                     2001:2:0:8000::10/64 | |       | |        2001:2:0:8000::108/64 |
|                      (00:07:43:2e:e4:78) | +-------+ |        (00:07:43:2e:e5:9a)   |
|                                          |           |                              |
|            static routes                 |           |                              |
| 192.18.0.0/16      => 198.18.0.108       |           |                              |
| 192.19.0.0/16      => 198.19.0.108       |           |                              |
| 2001:2::/49        => 2001:2::108        |           |                              |
| 2001:2:0:8000::/49 => 2001:2:0:8000::108 |           |                              |
|                                          |           |                              |
|        static arp and ndp                |           | /boot/loader.conf:           |
| 198.18.0.108        => 00:07:43:2e:e5:92 |           |      hw.cxgbe.num_vis=2      |
| 2001:2::108                              |           |                              |
|                                          |           |                              |
| 198.19.0.108        => 00:07:43:2e:e5:9a |           |                              |
| 2001:2:0:8000::108                       |           |                              |
+------------------------------------------+           +------------------------------+
The generator MUST generate lot's of smallest IP flows (multiple source/destination IP addresses and/or UDP src/dst port).
Here is an example for generating 2000 flows (100 different source IP * 20 different destination IP) at line-rate by using 2 threads:
pkt-gen -i vcxl0 -f tx -n 1000000000 -l 60 -d 198.19.10.1:2000-198.19.10.10 -D 00:07:43:2e:e4:70 -s 198.18.10.1:2000-198.18.10.20 -w 4 -p 2
And the same with IPv6 flows (minimum frame size of 62 here):
pkt-gen -f tx -i vcxl0 -n 1000000000 -l 62 -6 -d "[2001:2:0:8001::1]-[2001:2:0:8001::64]" -D 00:07:43:2e:e4:70 -s "[2001:2:0:1::1]-[2001:2:0:1::14]" -w 4 -p 2
Receiver will use this command:
pkt-gen -i vcxl1 -f rx -w 4
Basic configuration
Disabling Ethernet flow-control
First, disable Ethernet flow-control on both servers. Chelsio T540 are configured like this:
echo "dev.cxl.2.pause_settings=0" >> /etc/sysctl.conf
echo "dev.cxl.3.pause_settings=0" >> /etc/sysctl.conf
service sysctl reload
Disabling LRO and TSO
A router should not use LRO and TSO. BSDRP disable by default using a RC script (disablelrotso_enable=“YES” in /etc/rc.conf.misc).
IP Configuration on DUT
/etc/rc.conf:
# IPv4 router
gateway_enable="YES"
ifconfig_cxl0="inet 198.18.0.10/24 -tso4 -tso6 -lro"
ifconfig_cxl1="inet 198.19.0.10/24 -tso4 -tso6 -lro"
static_routes="generator receiver"
route_generator="-net 198.18.0.0/16 198.18.0.108"
route_receiver="-net 198.19.0.0/16 198.19.0.108"
static_arp_pairs="generator receiver"
static_arp_generator="198.18.0.108 00:07:43:2e:e5:92"
static_arp_receiver="198.19.0.108 00:07:43:2e:e5:9a"

# IPv6 router
ipv6_gateway_enable="YES"
ipv6_activate_all_interfaces="YES"
ifconfig_cxl0_ipv6="inet6 2001:2::10 prefixlen 64"
ifconfig_cxl1_ipv6="inet6 2001:2:0:8000::10 prefixlen 64"
ipv6_static_routes="generator receiver"
ipv6_route_generator="2001:2:: -prefixlen 49 2001:2::108"
ipv6_route_receiver="2001:2:0:8000:: -prefixlen 49 2001:2:0:8000::108"
static_ndp_pairs="generator receiver"
static_ndp_generator="2001:2::108 00:07:43:2e:e5:92"
static_ndp_receiver="2001:2:0:8000::108 00:07:43:2e:e5:9a"
Routing performance with default value
Default forwarding performance in front of a line-rate generator
Trying the “worse” scenario: Router receiving multiflows of almost line-rate: only 5Mpps are correctly forwarded (FreeBSD 12.0-CURRENT #1 r309510).
[root@hp]~# netstat -iw 1
            input        (Total)           output
   packets  errs idrops      bytes    packets  errs      bytes colls
   5284413     0     0  338202480    5284335     0  338197652     0
   5286851     0     0  338358470    5286409     0  338330290     0
   5286751     0     0  338352070    5287901     0  338381618     0
   5292884     0     0  338743878    5291437     0  338696178     0
   5288965     0     0  338494470    5289786     0  338546546     0
   5295780     0     0  338929926    5295438     0  338908082     0
   5283945     0     0  338172486    5284276     0  338193778     0
   5279643     0     0  337896454    5279034     0  337858226     0
   5287808     0     0  338420422    5288619     0  338471986     0
   5365838     0     0  343413638    5364807     0  343347634     0
   5315300     0     0  340179206    5316103     0  340230706     0
   5286934     0     0  338363782    5286508     0  338336626     0
   5279085     0     0  337861446    5279649     0  337897650     0
   5286925     0     0  338363206    5286167     0  338314738     0
   5295751     0     0  338928070    5296703     0  338989106     0
   5284070     0     0  338180166    5283137     0  338121010     0
   5285692     0     0  338282246    5285963     0  338301554     0
   5285824     0     0  338295110    5285093     0  338246194     0
The traffic is correctly load-balanced between NIC-queue/CPU binding:
[root@hp]~# vmstat -i | grep t5nex0
irq291: t5nex0:evt                     4          0
irq292: t5nex0:0a0                 44709         21
irq293: t5nex0:0a1               1063763        500
irq294: t5nex0:0a2                867671        408
irq295: t5nex0:0a3               1221772        575
irq296: t5nex0:0a4               1180242        555
irq297: t5nex0:0a5               1265724        595
irq298: t5nex0:0a6               1196989        563
irq299: t5nex0:0a7               1219212        574
irq305: t5nex0:1a0                  7028          3
irq306: t5nex0:1a1                  5625          3
irq307: t5nex0:1a2                  5653          3
irq308: t5nex0:1a3                  5697          3
irq309: t5nex0:1a4                  5882          3
irq310: t5nex0:1a5                  5784          3
irq311: t5nex0:1a6                  5617          3
irq312: t5nex0:1a7                  5613          3

[root@hp]~# top -nCHSIzs1
last pid:  2032;  load averages:  4.91,  3.52,  1.88  up 0+00:35:50    07:57:41
205 processes: 12 running, 106 sleeping, 87 waiting

Mem: 13M Active, 728K Inact, 504M Wired, 23M Buf, 62G Free
Swap:


  PID USERNAME   PRI NICE   SIZE    RES STATE   C   TIME     CPU COMMAND
   11 root       -92    -     0K  1440K CPU2    2   4:44  95.17% intr{irq292: t5nex0:0}
   11 root       -92    -     0K  1440K CPU5    5   5:04  91.26% intr{irq293: t5nex0:0}
   11 root       -92    -     0K  1440K CPU6    6   4:47  86.57% intr{irq294: t5nex0:0}
   11 root       -92    -     0K  1440K WAIT    3   4:51  86.47% intr{irq299: t5nex0:0}
   11 root       -92    -     0K  1440K WAIT    4   4:50  84.28% intr{irq298: t5nex0:0}
   11 root       -92    -     0K  1440K WAIT    7   4:39  82.28% intr{irq295: t5nex0:0}
   11 root       -92    -     0K  1440K WAIT    1   4:31  78.37% intr{irq297: t5nex0:0}
   11 root       -92    -     0K  1440K WAIT    0   4:19  74.56% intr{irq296: t5nex0:0}
   11 root       -60    -     0K  1440K WAIT    4   0:27   0.10% intr{swi4: clock (0)}
Where the system spend this time?
[root@hp]~# kldload hwpmc
[root@hp]~# pmcstat -TS CPU_CLK_UNHALTED_CORE -w 1
PMC: [CPU_CLK_UNHALTED_CORE] Samples: 320832 (100.0%) , 0 unresolved

%SAMP IMAGE      FUNCTION             CALLERS
 21.4 kernel     __rw_rlock           fib4_lookup_nh_basic:12.5 arpresolve:8.9
 15.8 kernel     _rw_runlock_cookie   fib4_lookup_nh_basic:9.8 arpresolve:5.9
  8.8 kernel     eth_tx               drain_ring
  6.3 kernel     bzero                ip_tryforward:1.7 fib4_lookup_nh_basic:1.6 ip_findroute:1.6 m_pkthdr_init:1.4
  4.1 kernel     bcopy                get_scatter_segment:1.7 arpresolve:1.3 eth_tx:1.1
  3.6 kernel     rn_match             fib4_lookup_nh_basic
  2.6 kernel     bcmp                 ether_nh_input
  2.0 kernel     ether_output         ip_tryforward
  2.0 kernel     mp_ring_enqueue      cxgbe_transmit
  2.0 libc.so.7  bsearch              0x63ac
  1.7 kernel     get_scatter_segment  service_iq
  1.6 kernel     ip_tryforward        ip_input
  1.5 kernel     cxgbe_transmit       ether_output
  1.4 kernel     fib4_lookup_nh_basic ip_findroute
  1.3 kernel     arpresolve           ether_output
  1.2 kernel     memcpy               ether_output
  1.2 kernel     ether_nh_input       netisr_dispatch_src
  1.1 kernel     service_iq           t4_intr
  1.1 kernel     reclaim_tx_descs     eth_tx
  1.0 kernel     drain_ring           mp_ring_enqueue
  1.0 kernel     uma_zalloc_arg       get_scatter_segment
Some lock contention on the fib4_lookup_nh_basic.
Equilibrium throughput
Previous methodology, by generating about 14Mpps, is like testing the DUT under a “Denial-of-Service”. Try another methodology known as equilibrium throughput.
IPv4
From the pkt-generator, start an estimation of the “equilibrium throughput” starting at 10Mpps:
[root@pkt-gen]~# equilibrium -d 00:07:43:2e:e4:70 -p -l 10000 -t vcxl0 -r vcxl1
Benchmark tool using equilibrium throughput method
- Benchmark mode: Throughput (pps) for Router
- UDP load = 18B, IPv4 packet size=46B, Ethernet frame size=60B
- Link rate = 10000 Kpps
- Tolerance = 0.01
Iteration 1
  - Offering load = 5000 Kpps
  - Step = 2500 Kpps
  - Measured forwarding rate = 5000 Kpps
Iteration 2
  - Offering load = 7500 Kpps
  - Step = 2500 Kpps
  - Trend = increasing
  - Measured forwarding rate = 5440 Kpps
Iteration 3
  - Offering load = 6250 Kpps
  - Step = 1250 Kpps
  - Trend = decreasing
  - Measured forwarding rate = 5437 Kpps
Iteration 4
  - Offering load = 5625 Kpps
  - Step = 625 Kpps
  - Trend = decreasing
  - Measured forwarding rate = 5442 Kpps
Iteration 5
  - Offering load = 5313 Kpps
  - Step = 312 Kpps
  - Trend = decreasing
  - Measured forwarding rate = 5313 Kpps
Iteration 6
  - Offering load = 5469 Kpps
  - Step = 156 Kpps
  - Trend = increasing
  - Measured forwarding rate = 5434 Kpps
Iteration 7
  - Offering load = 5391 Kpps
  - Step = 78 Kpps
  - Trend = decreasing
  - Measured forwarding rate = 5390 Kpps
Estimated Equilibrium Ethernet throughput= 5390 Kpps (maximum value seen: 5442 Kpps)
⇒ About the same performance as the “under DOS” bench (only running multiple times this same benchs can give valide “statistical” data).
IPv6
From the pkt-generator, start an estimation of the “equilibrium throughput” in IPv6 mode, starting at 10Mpps:
[root@pkt-gen]~# equilibrium -d 00:07:43:2e:e4:70 -p -l 10000 -t vcxl0 -r vcxl1 -6
Benchmark tool using equilibrium throughput method
- Benchmark mode: Throughput (pps) for Router
- UDP load = 0B, IPv6 packet size=48B, Ethernet frame size=62B
- Link rate = 10000 Kpps
- Tolerance = 0.01
Iteration 1
  - Offering load = 5000 Kpps
  - Step = 2500 Kpps
  - Measured forwarding rate = 2681 Kpps
Iteration 2
  - Offering load = 2500 Kpps
  - Step = 2500 Kpps
  - Trend = decreasing
  - Measured forwarding rate = 2499 Kpps
Iteration 3
  - Offering load = 3750 Kpps
  - Step = 1250 Kpps
  - Trend = increasing
  - Measured forwarding rate = 2682 Kpps
Iteration 4
  - Offering load = 3125 Kpps
  - Step = 625 Kpps
  - Trend = decreasing
  - Measured forwarding rate = 2681 Kpps
Iteration 5
  - Offering load = 2813 Kpps
  - Step = 312 Kpps
  - Trend = decreasing
  - Measured forwarding rate = 2681 Kpps
Iteration 6
  - Offering load = 2657 Kpps
  - Step = 156 Kpps
  - Trend = decreasing
  - Measured forwarding rate = 2657 Kpps
Iteration 7
  - Offering load = 2735 Kpps
  - Step = 78 Kpps
  - Trend = increasing
  - Measured forwarding rate = 2680 Kpps
Iteration 8
  - Offering load = 2696 Kpps
  - Step = 39 Kpps
  - Trend = decreasing
  - Measured forwarding rate = 2679 Kpps
Estimated Equilibrium Ethernet throughput= 2679 Kpps (maximum value seen: 2682 Kpps)
From 5.4Mpps in IPv4, it lower to 2.67Mppps in IPv6 (no fastforward with IPv6).
Firewall impact
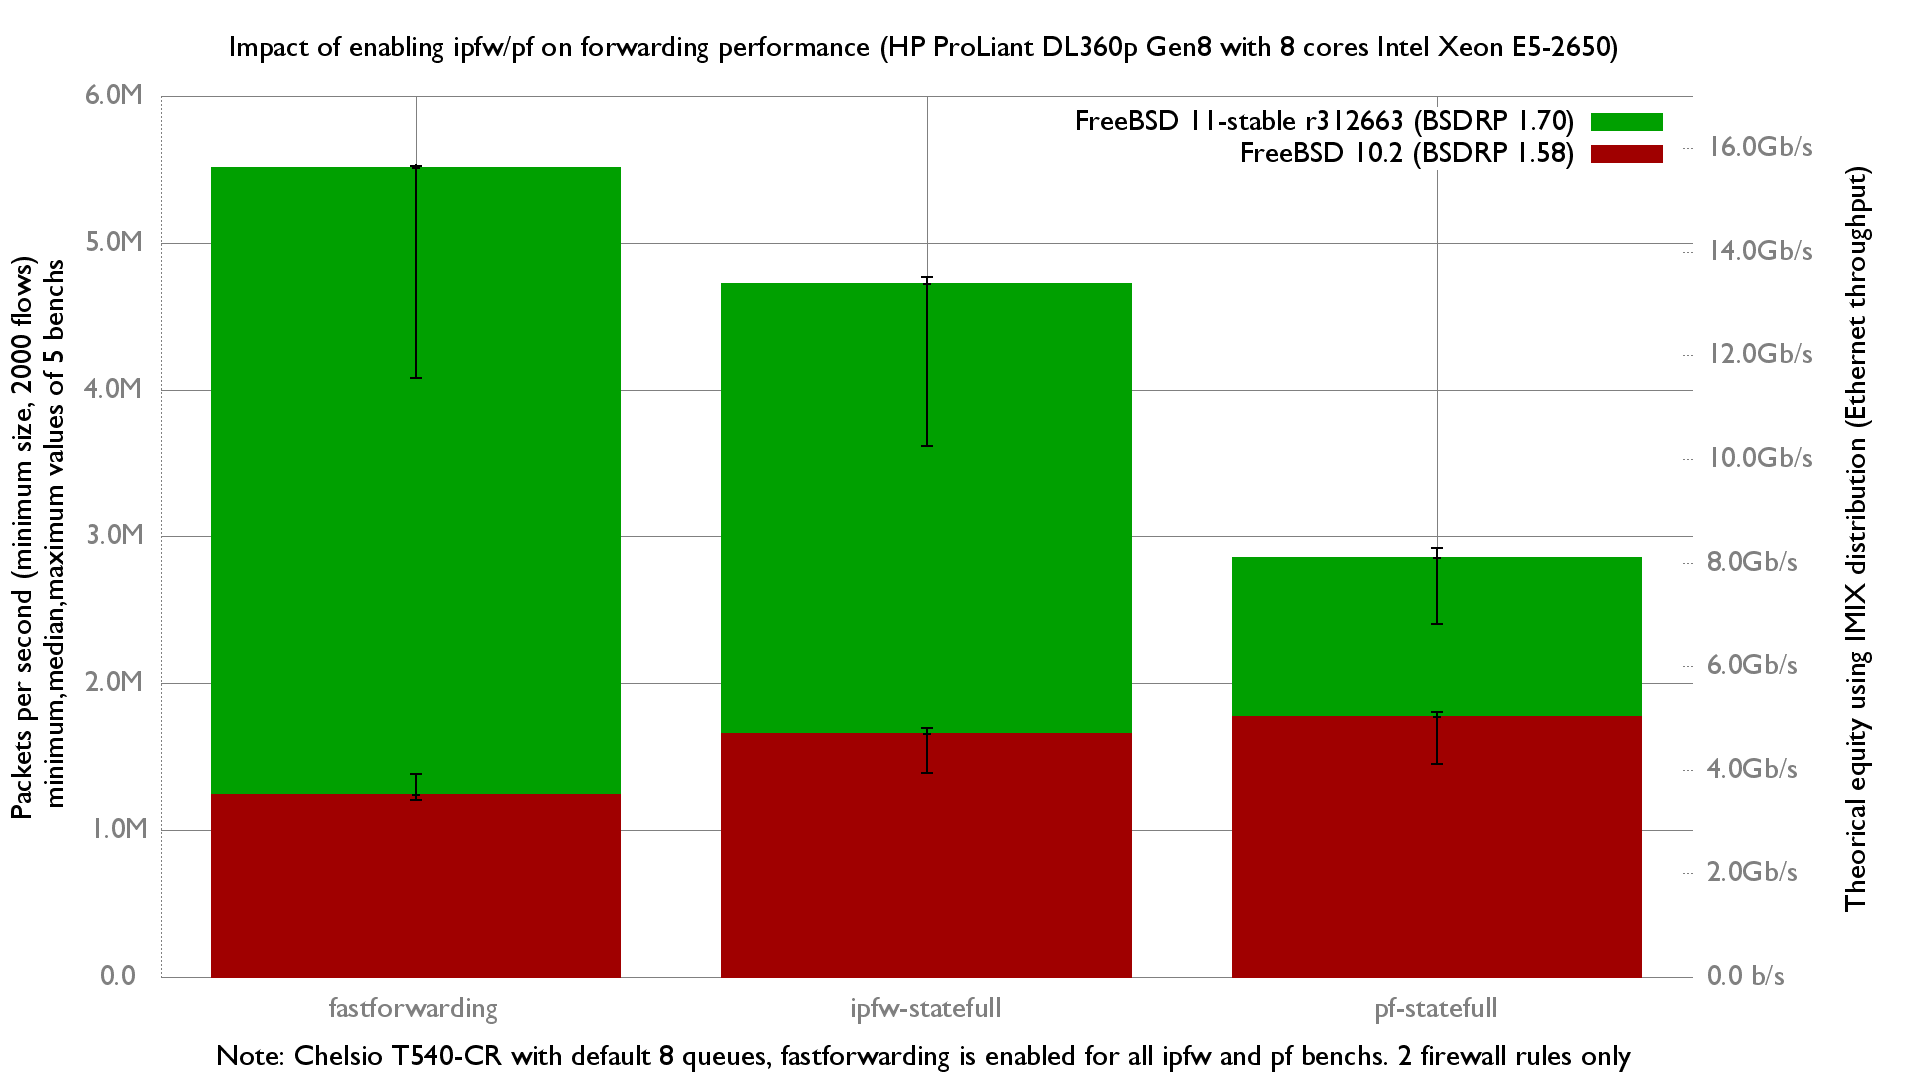
One rule for each firewall and 2000 UDP “sessions”, more information on the GigaEthernet performance lab.
tuning
BIOS
Chelsio drivers
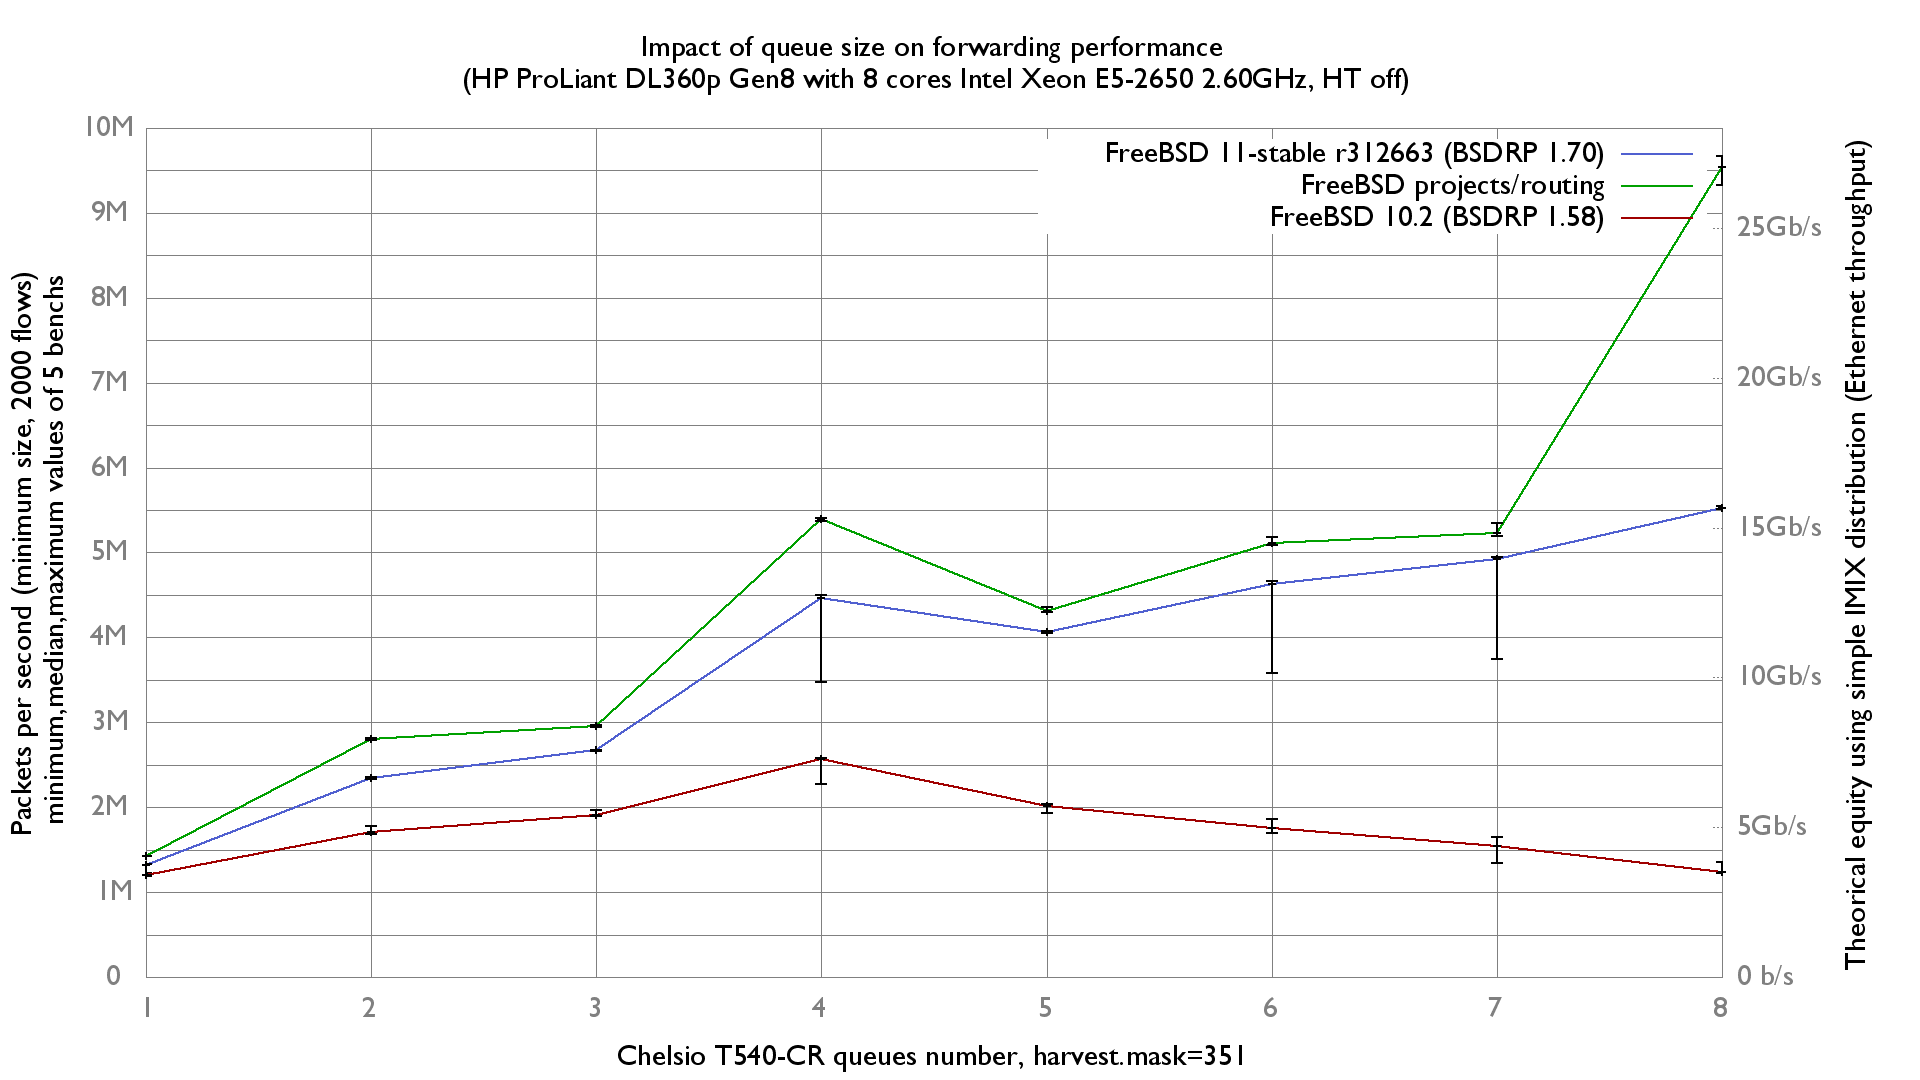
Reducing NIC queues (FreeBSD 11.0 or older only)
By default queues are:
- TX: 16 or ncpu if ncpu<16
- RX: 8 or ncpu if ncpu<8
Then in our case there are equal to 8:
[root@hp]~# sysctl dev.cxl.3.nrxq
dev.cxl.3.nrxq: 8
[root@hp]~# sysctl dev.cxl.3.ntxq
dev.cxl.3.ntxq: 8
Here is how to changes number of queue to 4:
mount -uw /
echo 'hw.cxgbe.ntxq10g="4"' >> /boot/loader.conf.local
echo 'hw.cxgbe.nrxq10g="4"' >> /boot/loader.conf.local
mount -ur /
reboot
descriptor ring size
The size, in number of entries, of the descriptor ring used for a RX and TX queue are 1024 by default.
[root@hp]~# sysctl dev.cxl.3.qsize_rxq
dev.cxl.3.qsize_rxq: 1024
[root@hp]~# sysctl dev.cxl.2.qsize_rxq
dev.cxl.2.qsize_rxq: 1024
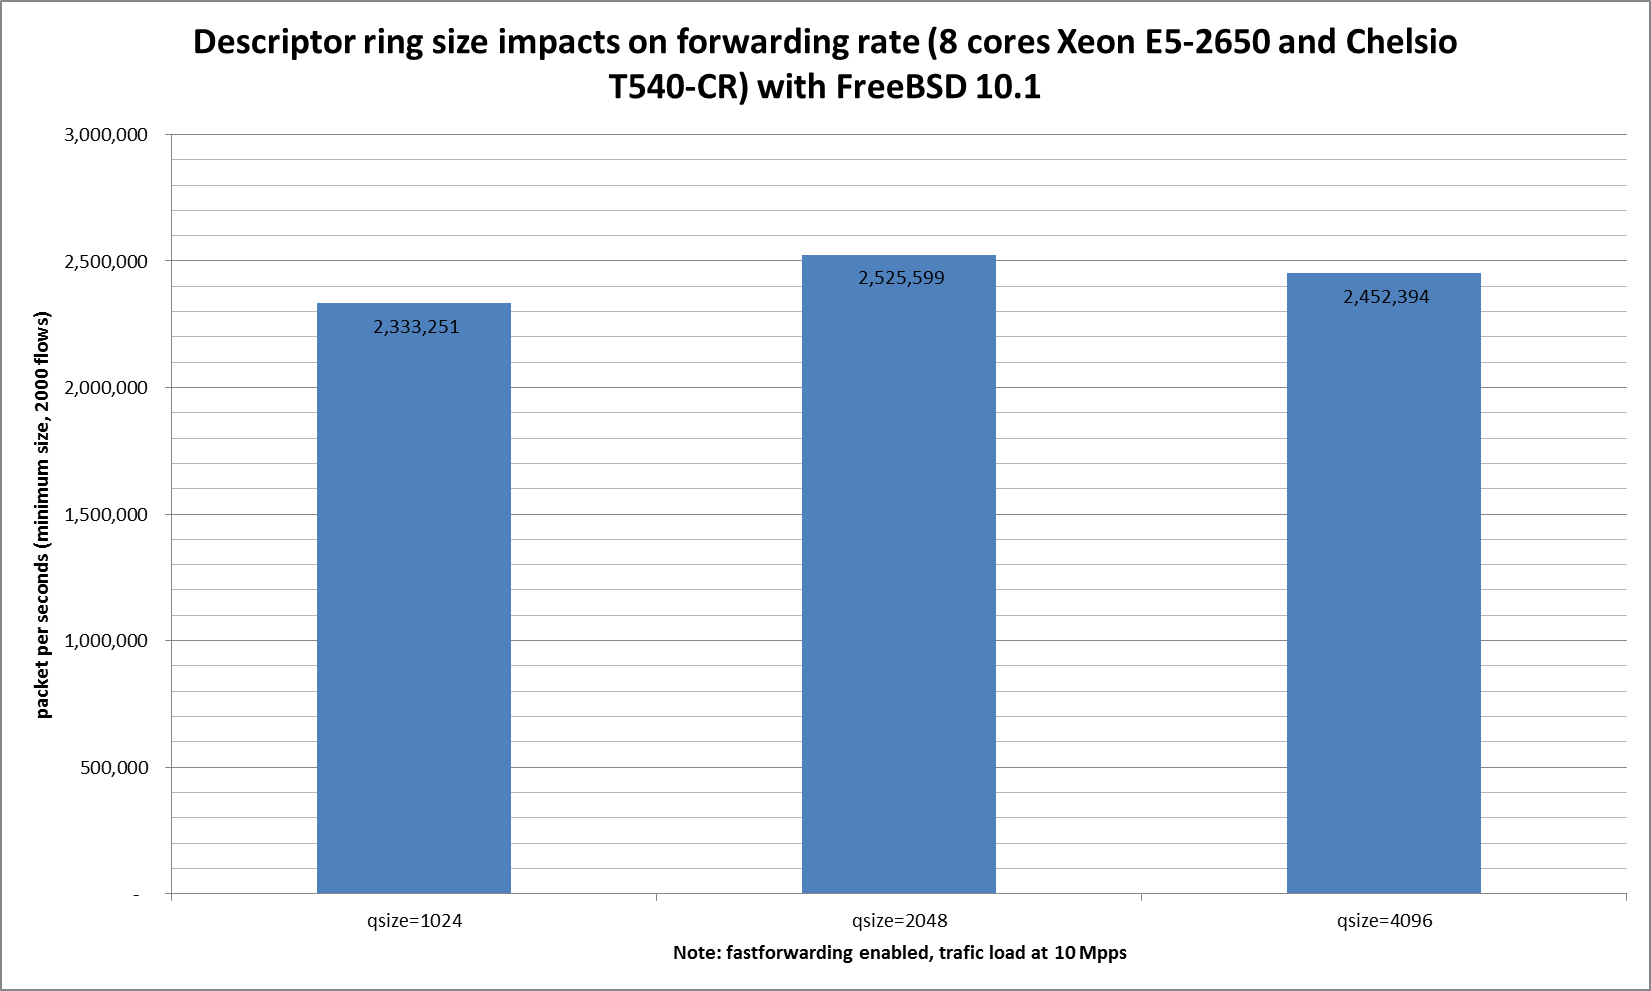
Let's change them to different value (1024, 2048 and 4096) and measuring the impact:
mount -uw /
echo 'hw.cxgbe.qsize_txq="4096"' >> /boot/loader.conf.local
echo 'hw.cxgbe.qsize_rxq="4096"' >> /boot/loader.conf.local
mount -ur /
reboot
Ministat:
x pps.qsize1024
+ pps.qsize2048
* pps.qsize4096
+--------------------------------------------------------------------------+
|x    x                      *+x       +*        x**    x    +        *+ + |
|   |________________________A_M_____________________|                     |
|                                  |___________________A_____M____________||
|                                |______________A_M____________|           |
+--------------------------------------------------------------------------+
    N           Min           Max        Median           Avg        Stddev
x   5       2148318       2492921       2333251     2321334.2     154688.45
+   5       2328049       2596042       2525599       2484254     120543.04
No difference proven at 95.0% confidence
*   5       2325210       2581890       2452394     2442485.8     94913.584
No difference proven at 95.0% confidence
By reading the graphic it seems there is a better behaviour with a qsize of 2048, but ministat answers to 5 benchs says there is not.


