FreeBSD Forwarding Performance
There are many guides on tuning FreeBSD TCP performance (where the FreeBSD host is an endpoint of the TCP session), but this is not the same as tuning forwarding (where the FreeBSD host does not need to read the TCP information of the packets it forwards) or firewalling performance.
Concepts
How to benchmark a router
Benchmarking a router is not about measuring the maximum bandwidth crossing it; it is about measuring the network throughput in packets per second (pps):
- RFC1242: Benchmarking Terminology for Network Interconnection Devices
- RFC2544: Benchmarking Methodology for Network Interconnect Devices
- RFC3222: Terminology for Forwarding Information Base (FIB) based Router Performance
- The Journal of Internet Test Methodologies (pdf)
Definition
A clear definition of the relationship between bandwidth and frame rate is necessary:
- Bandwidth, Packets Per Second, and Other Network Performance Metrics: The relationship of bandwidth and packet forwarding rate
- LAN Ethernet Maximum Rates, Generation, Capturing & Monitoring: another good explanation of the Ethernet maximum rates
Benchmarks
Cisco or Linux
- Routing performance of Cisco routers (PDF)
- Pushing the Limits of Kernel Networking (September 2015): Linux RedHat 7.2: 1.3 Mpps per core, and "Beyond the ninth CPU we see some gain but all results are pretty much fixed at 12.4Mpps as this is the limit of the PCIe bandwidth for the device."
- RFC2544 Performance Evaluation for a Linux Based Open Router (June 2006)
- Towards 10Gb/s open-source routing (2008): includes a hardware comparison between a "real" router and a PC.
- Performance consideration for packet processing on Intel Architecture (ppt)
FreeBSD
Benchmarks of FreeBSD network forwarding performance, conducted by the BSDRP team:
- AsiaBSDCon 2018 - Tuning FreeBSD for routing and firewalling (paper, slides, and video)
- Recipe for building a 10 Mpps FreeBSD-based router
- Impact of enabling ipfw or pf on fastforwarding performance with an 8-core Xeon E5-2650: 9.5 Mpps
- Impact of enabling ipfw or pf on fastforwarding performance with a 4-core Xeon L5630: gigabit line-rate (1.48 Mpps) even with a few ipfw or pf rules enabled
- Impact of enabling ipfw or pf on fastforwarding performance with a 4-core Atom C2558E (Netgate RCC-VE 4860): small device, ideal for 1 Gb/s of IMIX traffic
- Impact of enabling ipfw or pf on fastforwarding performance with a 2-core AMD G-T40E (PC Engines APU): another cheap router that reaches about 400 Mb/s of IMIX
Bench lab
The bench lab should be set up to measure pps. For accurate results, RFC 2544 (Benchmarking Methodology for Network Interconnect Devices) is a good reference. If switches are used, they must be configured properly; see the BSDRP performance lab for examples.
Tuning
Literature
A list of resources for optimizing and analyzing forwarding performance under FreeBSD.
Benchmarking and tuning the network stack:
- FreeBSD Network Performance Tuning: what needs to be done to tune the networking stack
- Brendan Gregg's performance analysis presentation: the "must-read" how-to
- FreeBSD Network Performance Project (netperf)
- Introduction to Multithreading and Multiprocessing in the FreeBSD SMPng Network Stack, EuroBSDCon 2005 (PDF)
- man tuning: performance tuning under FreeBSD
- Improving Memory and Interrupt Processing in FreeBSD Network Stack (PDF)
- Optimizing the BSD Routing System for Parallel Processing (PDF)
- Using netstat and vmstat for performance analysis (PowerPoint)
- polling man page (warning: enabling polling is not a good idea with modern Ethernet controllers that include interrupt moderation)
- Device Polling support for FreeBSD: the original presentation of the polling implementation
- Tuning Kernel Limits in the FreeBSD Handbook
Experimental high-performance FreeBSD network stacks:
- Netmap - memory mapping of network devices "(...) a single core running at 1.33 GHz can generate the 14.8 Mpps that saturate a 10 GigE interface."
- Network Stack Specialization for Performance: this paper presents Sandstorm, a clean-slate userspace network stack based on Netmap
Multiple flows
Do not benchmark a router with only one flow (same source and destination address, same source and destination port). You need to generate multiple flows. Multi-queue NICs use features like the Toeplitz hash algorithm to balance multiple flows across all cores. Generating only one flow will use only a single NIC queue and a single core.
During the load test, check that every queue is in use, either with sysctl or with a Python script like this one that displays real-time queue usage.
In the following example all flows are correctly spread across the 8 queues (about 340K packets per second on each):
[root@router]~# nic-queue-usage cxl0
[Q0   346K/s] [Q1   343K/s] [Q2   339K/s] [Q3   338K/s] [Q4   338K/s] [Q5   338K/s] [Q6   343K/s] [Q7   346K/s] [QT  2734K/s  3269K/s ->     0K/s]
[Q0   347K/s] [Q1   344K/s] [Q2   339K/s] [Q3   339K/s] [Q4   338K/s] [Q5   338K/s] [Q6   343K/s] [Q7   346K/s] [QT  2735K/s  3277K/s ->     0K/s]
[Q0   344K/s] [Q1   341K/s] [Q2   338K/s] [Q3   338K/s] [Q4   337K/s] [Q5   337K/s] [Q6   342K/s] [Q7   345K/s] [QT  2727K/s  3262K/s ->     0K/s]
[Q0   355K/s] [Q1   352K/s] [Q2   348K/s] [Q3   349K/s] [Q4   348K/s] [Q5   347K/s] [Q6   352K/s] [Q7   355K/s] [QT  2809K/s  3381K/s ->     0K/s]
[Q0   351K/s] [Q1   348K/s] [Q2   344K/s] [Q3   343K/s] [Q4   342K/s] [Q5   344K/s] [Q6   349K/s] [Q7   352K/s] [QT  2776K/s  3288K/s ->     0K/s]
[Q0   344K/s] [Q1   341K/s] [Q2   338K/s] [Q3   339K/s] [Q4   338K/s] [Q5   338K/s] [Q6   343K/s] [Q7   346K/s] [QT  2731K/s  3261K/s ->     0K/s]
Warning
Beware of configurations that defeat multi-queueing, such as GRE, GIF, and IPsec tunnels, or PPPoE (which uses the same source and destination address). If you must run PPPoE on your gigabit internet link, small hardware such as a 4-core AMD GX (PC Engines APU2) will not be able to reach gigabit speed.
Choosing hardware
CPU
Avoid NUMA architectures; prefer a CPU in a single package with the maximum number of cores. If you do use NUMA, make sure inbound and outbound NIC queues are pinned to their local domain to avoid unnecessary QPI traffic.
Network interface card
Mellanox and Chelsio combine good chipsets with excellent drivers and are an excellent choice.
Intel cards seem to have trouble handling a large number of PPS (interrupts), and their team appears to be short on FreeBSD developers.
Avoid the "embedded" NICs on common Dell and HP servers; they perform very poorly in terms of maximum packets-per-second throughput:
- 10G Emulex OneConnect (be3)
- 10G Broadcom NetXtreme II BCM57810
Choosing the right FreeBSD release
Before tuning, make sure you are running a recent FreeBSD release; the main branch is recommended.
BSDRP follows the FreeBSD main branch to strike a balance between recent features and stability (and yes, it is quite stable).
Disabling Hyper-Threading (on specific CPUs only)
By default, a multi-queue NIC driver creates one queue per core. However, on some older CPUs (such as the Xeon E5-2650 v1), the logical cores do not help at all with handling interrupts from a high-speed NIC.
HT can be disabled with:
echo 'machdep.hyperthreading_allowed="0"' >> /boot/loader.conf
Here is an example on a Xeon E5-2650 (8c/16t) with a 10G Chelsio NIC, where disabling HT improves performance:
x HT-enabled-8rxq(default): inet packets-per-second forwarded
+ HT-enabled-16rxq: inet packets-per-second forwarded
* HT-disabled-8rxq: inet packets-per-seconds forwarded
+--------------------------------------------------------------------------+
|                                                                        **|
|x      xx    x          +       + + +  +                               ***|
|   |____A_____|                                                           |
|                           |_____AM____|                                  |
|                                                                       |A||
+--------------------------------------------------------------------------+
    N           Min           Max        Median           Avg        Stddev
x   5       4500078       4735822       4648451     4648293.8     94545.404
+   5       4925106       5198632       5104512     5088362.1     102920.87
Difference at 95.0% confidence
        440068 +/- 144126
        9.46731% +/- 3.23827%
        (Student's t, pooled s = 98821.9)
*   5       5765684     5801231.5       5783115     5785004.7     13724.265
Difference at 95.0% confidence
        1.13671e+06 +/- 98524.2
        24.4544% +/- 2.62824%
        (Student's t, pooled s = 67554.4)
Disabling Hyper-Threading on this old CPU gives a benefit of about 24%.
By contrast, on a Xeon E5-2650L (10c/20t) it is beneficial to keep HT enabled and configure the NIC to use all threads:
x HT on, 8q (default): inet4 packets-per-second forwarded
+ HT off, 8q: inet4 packets-per-second forwarded
* HT on, 16q: inet4 packets-per-second forwarded
+--------------------------------------------------------------------------+
|x x              ++                                                   *  *|
|x xx            +++                                                 * *  *|
||AM|            |A_|                                                |_MA_||
+--------------------------------------------------------------------------+
    N           Min           Max        Median           Avg        Stddev
x   5       4265579     4433699.5     4409249.5     4359580.3       81559.4
+   5       5257621       5443012       5372493     5372693.5     73316.243
Difference at 95.0% confidence
        1.01311e+06 +/- 113098
        23.2388% +/- 2.94299%
        (Student's t, pooled s = 77547.4)
*   5       8566972       8917315     8734750.5     8769616.1     147186.74
Difference at 95.0% confidence
        4.41004e+06 +/- 173536
        101.157% +/- 5.21388%
        (Student's t, pooled s = 118987)
Fastforwarding
FreeBSD 12.0 or newer
Enable tryforward by disabling ICMP redirects:
echo "net.inet.ip.redirect=0"  >> /etc/sysctl.conf
echo "net.inet6.ip6.redirect=0" >> /etc/sysctl.conf
service sysctl restart
Entropy harvest impact
Many tuning guides suggest disabling:
- kern.random.sys.harvest.ethernet
- kern.random.sys.harvest.interrupt
By default, the binary mask 511 selects almost every source as an entropy source:
kern.random.harvest.mask_symbolic: [UMA],[FS_ATIME],SWI,INTERRUPT,NET_NG,NET_ETHER,NET_TUN,MOUSE,KEYBOARD,ATTACH,CACHED
kern.random.harvest.mask_bin: 00111111111
kern.random.harvest.mask: 511
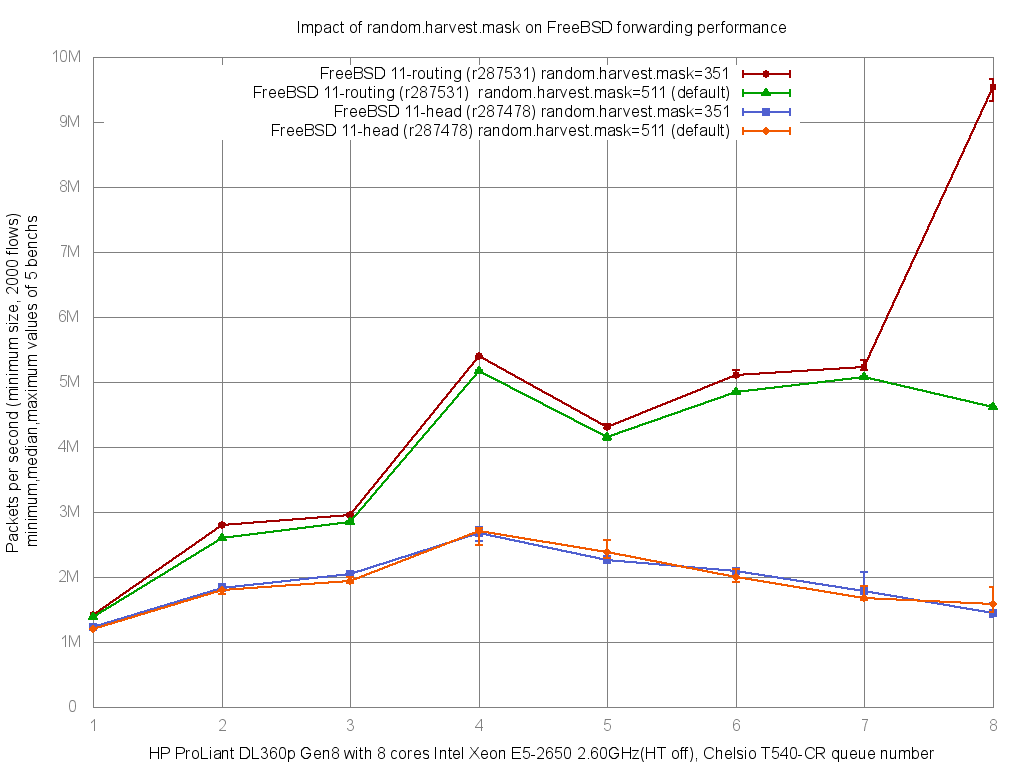
Replacing this mask with 351 excludes INTERRUPT and NET_ETHER:
kern.random.harvest.mask_symbolic: [UMA],[FS_ATIME],SWI,[INTERRUPT],NET_NG,[NET_ETHER],NET_TUN,MOUSE,KEYBOARD,ATTACH,CACHED
kern.random.harvest.mask_bin: 00101011111
kern.random.harvest.mask: 351
On FreeBSD 11.1, the impact on forwarding performance is visible:
x PC-Engines-APU2-igb, 511 (default): inet4 packets-per-second
+ PC-Engines-APU2-igb, 351: inet4 packets-per-second
+--------------------------------------------------------------------------+
|xx  x       xx                                 +      +    +    +        +|
||___M_A_____|                                                             |
|                                                  |________A_________|    |
+--------------------------------------------------------------------------+
    N           Min           Max        Median           Avg        Stddev
x   5        724811        730197        726304      727281.6     2522.9161
+   5        744832      755871.5        749956      750112.9     4208.7383
Difference at 95.0% confidence
        22831.3 +/- 5060.46
        3.13927% +/- 0.701645%
        (Student's t, pooled s = 3469.77
On a PC Engines APU2 the performance benefit is about 3%.
x Netgate-igb, 511 (default): inet4 packets-per-second
+ Netgate-igb, 351: inet4 packets-per-second
+--------------------------------------------------------------------------+
|x x    x          x     x                                   ++      +  + +|
||______M__A__________|                                                    |
|                                                             |_____AM___| |
+--------------------------------------------------------------------------+
    N           Min           Max        Median           Avg        Stddev
x   5      946426.5        965962        951906      954721.7     8435.4561
+   5        994839       1005327       1000935     1000098.2     4620.4263
Difference at 95.0% confidence
        45376.5 +/- 9918.76
        4.75285% +/- 1.0771%
        (Student's t, pooled s = 6800.93)
On a Netgate RCC-VE 4860 the benefit is about 4.7%.
On the FreeBSD projects/routing branch the impact is much larger:
NIC driver tuning
RX and TX descriptor (queue) size on igb
The receive (hw.igb.rxd) and transmit (hw.igb.txd) internal buffer sizes of the igb and em drivers can be increased, but doing so is not a good idea.
The following examples show performance decreasing as the buffer size increases:
x PC-Engine-APU2-igb, 1024 (default): inet4 packets-per-second
+ PC-Engine-APU2-igb, 2048: inet4 packets-per-second
* PC-Engine-APU2-igb, 4096: inet4 packets-per-second
+--------------------------------------------------------------------------+
|*                                                                         |
|* ***                  + +  +++                                      xx xx|
|                                                                      MA| |
|                        |__AM_|                                           |
||_A_|                                                                     |
+--------------------------------------------------------------------------+
    N           Min           Max        Median           Avg        Stddev
x   5        724024        731531        726058      727317.6     3006.2996
+   5        626546        640326        637463      634497.6     5856.2198
Difference at 95.0% confidence
        -92820 +/- 6788.67
        -12.762% +/- 0.909828%
        (Student's t, pooled s = 4654.74)
*   5        577830        585426        582886      581913.4     3413.6019
Difference at 95.0% confidence
        -145404 +/- 4690.94
        -19.9918% +/- 0.592106%
        (Student's t, pooled s = 3216.4)
On a PC Engines APU2, increasing the RX and TX buffers hurts forwarding performance by about 20%.
x Netgate-igb, 1024 (default): inet4 packets-per-second
+ Netgate-igb, 2048: inet4 packets-per-second
* Netaget-igb, 4096: inet4 packets-per-second
+--------------------------------------------------------------------------+
|*      *       *    *   *+   ++      +    +               x   x x      x x|
|                                                           |____MA______| |
|                          |___M__A______|                                 |
|   |_________A_M______|                                                   |
+--------------------------------------------------------------------------+
    N           Min           Max        Median           Avg        Stddev
x   5        943843        961431        950960      952699.4     7285.7808
+   5        907050        926520        912317      915489.3       7816.85
Difference at 95.0% confidence
        -37210.1 +/- 11020
        -3.90575% +/- 1.13593%
        (Student's t, pooled s = 7555.98)
*   5        877923        904869        894519      892616.2     10954.317
Difference at 95.0% confidence
        -60083.2 +/- 13567.4
        -6.30663% +/- 1.39717%
        (Student's t, pooled s = 9302.68)
On a Netgate RCC-VE 4860 performance drops by about 6%.
Maximum number of received packets to process at a time (Intel)
By default, Intel drivers (em and igb) limit the number of received packets processed in one pass (hw.igb.rx_process_limit=100).
Disabling this limit gives a small improvement in overall performance:
x PC-Engines-APU2-igb, 100 (default): inet4 packets-per-second
+ PC-Engines-APU2-igb, disabled: inet4 packets-per-second
+--------------------------------------------------------------------------+
|x         x                   x   x     x               +        ++ +    +|
|      |________________A______M_________|                                 |
|                                                            |_____A_____| |
+--------------------------------------------------------------------------+
    N           Min           Max        Median           Avg        Stddev
x   5        721322        729817        727669      726175.8     3592.7624
+   5        733327        736835        735392      735283.4     1266.5036
Difference at 95.0% confidence
        9107.6 +/- 3928.6
        1.25419% +/- 0.547037%
        (Student's t, pooled s = 2693.69)
A small 1% improvement on a PC Engines APU2.
x Netgate-igb, 100 (default): inet4 packets-per-second
+ Netgate-igb, disabled: inet4 packets-per-second
+--------------------------------------------------------------------------+
|x    x         x                    x              x  +    + +        +  +|
||______________M_____A_____________________|                              |
|                                                       |_____M_A_______|  |
+--------------------------------------------------------------------------+
    N           Min           Max        Median           Avg        Stddev
x   5        943049        963053        948889      951350.1     8428.1046
+   5        964038        971603        966764      967747.4     3168.1615
Difference at 95.0% confidence
        16397.3 +/- 9285.49
        1.72358% +/- 0.990789%
        (Student's t, pooled s = 6366.72)
Almost same improvement, 1.7% on a Netgate.
Increasing maximum interrupts per second
By default, the igb and em drivers limit the maximum number of interrupts per second to 8000.
The effect of increasing this number:
x PC-Engine-APU2-igb, max_interrupt_rate=8000 (default): inet4 pps
+ PC-Engine-APU2-igb, max_interrupt_rate=16000: inet4 pps
* PC-Engine-APU2-igb, max_interrupt_rate=32000: inet4 pps
+--------------------------------------------------------------------------+
|x           x              +   x*     *+*              *  x+x           +*|
|     |_________________________MA__________________________|              |
|                         |_____________M_____A___________________|        |
|                                |_______M_______A_______________|         |
+--------------------------------------------------------------------------+
    N           Min           Max        Median           Avg        Stddev
x   5        721191        730448        725919      726128.6     4137.1981
+   5        725281        732247        727142        728045     3083.0635
No difference proven at 95.0% confidence
*   5        726157        732417        727400        728554     2518.7778
No difference proven at 95.0% confidence
No benefit on a PC Engines APU2.
x Netgate-igb, max_interrupt_rate=8000 (default): inet4 pps
+ Netgate-igb, max_interrupt_rate=16000: inet4 pps
* Netgate-igb, max_interrupt_rate=32000: inet4 pps
+--------------------------------------------------------------------------+
|x              *   x    x*   +*   x       +       *       +   +    *     +|
|       |________________MA__________________|                             |
|                                    |________________A____M___________|   |
|                |_____________M_______A____________________|              |
+--------------------------------------------------------------------------+
    N           Min           Max        Median           Avg        Stddev
x   5      936969.5        954851        945631      946049.3      6595.479
+   5        947461        962965        957754        955782      6143.043
Difference at 95.0% confidence
        9732.7 +/- 9295.06
        1.02877% +/- 0.987938%
        (Student's t, pooled s = 6373.28)
*   5        942302        960913        947667      950327.4     7504.7836
No difference proven at 95.0% confidence
A small 1% benefit when doubled from the default (8000 to 16000), but no further benefit after that.
Disabling LRO and TSO
All modern NICs support LRO and TSO, but both features must be disabled on a router:
- They buffer multiple packets at the NIC level before handing them up the stack. This adds latency, and because the packets must be sent out again, the stack has to split them back into separate packets before handing them down to the NIC. The Intel drivers readme includes this note: "The result of not disabling LRO when combined with ip forwarding or bridging can be low throughput or even a kernel panic."
- They break the end-to-end principle.
Disabling these features has no real impact on PPS performance:
x Xeon_E5-2650-8Cores-Chelsio_T540, TSO-LRO-enabled (default): inet4 packets-per-second
+ Xeon_E5-2650-8Cores-Chelsio_T540, TSO-LRO-disabled: inet4 packets-per-second
+--------------------------------------------------------------------------+
|x                    x     +x        +     x  +x                   +     +|
|         |__________________A__________________|                          |
|                              |_______________M___A__________________|    |
+--------------------------------------------------------------------------+
    N           Min           Max        Median           Avg        Stddev
x   5       5727360     5806270.5       5773573     5773454.5     31394.005
+   5       5771681       5848728       5803277     5810232.2     32556.338
No difference proven at 95.0% confidence
Where is the bottleneck?
Tools:
- MeetBSD 2014 - Brendan Gregg's performance analysis presentation: the ultimate guide to performance analysis on FreeBSD
- netstat: show network status
- vmstat: report virtual memory statistics
- top: display and update information about the top CPU processes
- pmcstat: measure performance using hardware counters
Packet load
Display packet-traffic information, refreshed every second.
Here is an example:
[root@hp]~# netstat -ihw1
            input        (Total)           output
   packets  errs idrops      bytes    packets  errs      bytes colls
       14M     0  7.9M       836M       5.8M     0       353M     0
       14M     0  8.0M       841M       5.8M     0       352M     0
       14M     0  8.1M       849M       5.8M     0       353M     0
       14M     0  7.8M       833M       5.8M     0       352M     0
       14M     0  7.9M       837M       5.8M     0       352M     0
       14M     0  8.0M       843M       5.8M     0       353M     0
       14M     0  7.9M       838M       5.8M     0       352M     0
This system is receiving 14 Mpps (10G line rate) but only manages to forward 5.8 Mpps, so it has to drop about 8 Mpps.
Traffic distribution across queues
Check that the input queues are evenly loaded. BSDRP includes a sysctl parser script for this:
[root@hp]~# nic-queue-usage cxl0
[Q0   935K/s] [Q1   944K/s] [Q2   925K/s] [Q3   912K/s] [Q4   914K/s] [Q5   914K/s] [Q6   930K/s] [Q7   922K/s] [QT  7400K/s 17749K/s ->     2K/s]
[Q0   886K/s] [Q1   892K/s] [Q2   872K/s] [Q3   883K/s] [Q4   885K/s] [Q5   885K/s] [Q6   906K/s] [Q7   900K/s] [QT  7112K/s 16950K/s ->     1K/s]
[Q0   874K/s] [Q1   879K/s] [Q2   855K/s] [Q3   855K/s] [Q4   852K/s] [Q5   842K/s] [Q6   866K/s] [Q7   860K/s] [QT  6887K/s 16748K/s ->     1K/s]
[Q0   892K/s] [Q1   899K/s] [Q2   870K/s] [Q3   865K/s] [Q4   873K/s] [Q5   882K/s] [Q6   899K/s] [Q7   893K/s] [QT  7076K/s 17023K/s ->     1K/s]
[Q0   880K/s] [Q1   890K/s] [Q2   878K/s] [Q3   882K/s] [Q4   883K/s] [Q5   885K/s] [Q6   904K/s] [Q7   896K/s] [QT  7102K/s 16864K/s ->     1K/s]
[Q0   894K/s] [Q1   891K/s] [Q2   868K/s] [Q3   864K/s] [Q4   860K/s] [Q5   860K/s] [Q6   882K/s] [Q7   873K/s] [QT  6996K/s 17154K/s ->     1K/s]
[Q0   876K/s] [Q1   889K/s] [Q2   873K/s] [Q3   876K/s] [Q4   881K/s] [Q5   878K/s] [Q6   898K/s] [Q7   890K/s] [QT  7064K/s 16586K/s ->     1K/s]
[Q0   957K/s] [Q1   964K/s] [Q2   941K/s] [Q3   941K/s] [Q4   943K/s] [Q5   945K/s] [Q6   967K/s] [Q7   963K/s] [QT  7624K/s 18220K/s ->     1K/s]
[Q0   864K/s] [Q1   873K/s] [Q2   853K/s] [Q3   852K/s] [Q4   854K/s] [Q5   856K/s] [Q6   874K/s] [Q7   868K/s] [QT  6897K/s 16413K/s ->     1K/s]
All 8 receive queues are used correctly here.
Interrupt usage
Report the number of interrupts taken by each device since system startup.
Here is an example:
[root@hp]~# vmstat -i
interrupt                          total       rate
irq1: atkbd0                           6          0
irq4: uart0                            3          0
irq20: ehci1                        3263          3
irq21: ehci0                       12612         10
cpu0:timer                        749022        583
cpu6:timer                        736682        573
cpu7:timer                        742555        578
cpu1:timer                        739964        576
cpu2:timer                        739621        575
cpu5:timer                        738796        575
cpu4:timer                        738756        575
cpu3:timer                        737954        574
irq273: igb1:que 0                  1291          1
irq274: igb1:que 1                  1245          1
irq275: igb1:que 2                  1245          1
irq276: igb1:que 3                  1246          1
irq277: igb1:que 4                  1245          1
irq278: igb1:que 5                  2435          2
irq279: igb1:que 6                  1245          1
irq280: igb1:que 7                  1245          1
irq281: igb1:link                      2          0
irq283: t5nex0:evt                     4          0
irq284: t5nex0:0a0                608689        474
irq285: t5nex0:0a1                281882        219
irq286: t5nex0:0a2                875179        681
irq287: t5nex0:0a3                813033        632
irq288: t5nex0:0a4                968845        754
irq289: t5nex0:0a5               1099491        855
irq290: t5nex0:0a6                 58210         45
irq291: t5nex0:0a7                638755        497
irq294: t5nex0:1a0                102669         80
irq295: t5nex0:1a1                136891        106
irq296: t5nex0:1a2                 51888         40
irq297: t5nex0:1a3                 59324         46
irq298: t5nex0:1a4                 61052         47
irq299: t5nex0:1a5                 80827         63
irq300: t5nex0:1a6                 88800         69
irq301: t5nex0:1a7                102177         79
Total                           11978149       9318
There is no IRQ sharing here, and each queue has its own IRQ (thanks to MSI-X).
Memory buffers
Show statistics recorded by the memory-management routines. The network stack manages its own private pool of memory buffers.
[root@hp]~# vmstat -z | head -1 ; vmstat -z | grep -i mbuf
ITEM                   SIZE  LIMIT     USED     FREE      REQ FAIL SLEEP
mbuf_packet:            256, 26137965,    8190,    1424,    9121,   0,   0
mbuf:                   256, 26137965,    3657,    4699,4372990387,   0,   0
mbuf_cluster:          2048, 4084056,    9614,      12,    9614,   0,   0
mbuf_jumbo_page:       4096, 2042027,   16192,     131,   16207,   0,   0
mbuf_jumbo_9k:         9216, 605045,       0,       0,       0,   0,   0
mbuf_jumbo_16k:       16384, 340337,     128,       0,     128,   0,   0
No "failed" entries here.
CPU / NIC
top provides useful information about CPU/NIC affinity:
[root@hp]~# top -CHIPS
last pid:  1180;  load averages: 10.05,  8.86,  5.71                                                 up 0+00:23:58  12:05:19
187 processes: 15 running, 100 sleeping, 72 waiting
CPU 0:  0.0% user,  0.0% nice,  0.0% system, 96.9% interrupt,  3.1% idle
CPU 1:  0.0% user,  0.0% nice,  0.0% system, 99.2% interrupt,  0.8% idle
CPU 2:  0.0% user,  0.0% nice,  0.0% system, 99.6% interrupt,  0.4% idle
CPU 3:  0.0% user,  0.0% nice,  0.0% system, 97.7% interrupt,  2.3% idle
CPU 4:  0.0% user,  0.0% nice,  0.0% system, 98.1% interrupt,  1.9% idle
CPU 5:  0.0% user,  0.0% nice,  0.0% system, 97.3% interrupt,  2.7% idle
CPU 6:  0.0% user,  0.0% nice,  0.0% system, 97.7% interrupt,  2.3% idle
CPU 7:  0.0% user,  0.0% nice,  0.0% system, 97.3% interrupt,  2.7% idle
Mem: 16M Active, 16M Inact, 415M Wired, 7239K Buf, 62G Free
Swap:

  PID USERNAME   PRI NICE   SIZE    RES STATE   C   TIME     CPU COMMAND
   12 root       -92    -     0K  1248K CPU1    1  13:14 100.00% intr{irq285: t5nex0:0a1}
   12 root       -92    -     0K  1248K CPU7    7  13:09  98.54% intr{irq284: t5nex0:0a0}
   12 root       -92    -     0K  1248K WAIT    3  13:10  98.21% intr{irq291: t5nex0:0a7}
   12 root       -92    -     0K  1248K WAIT    6  13:02  97.33% intr{irq287: t5nex0:0a3}
   12 root       -92    -     0K  1248K CPU0    0  13:02  97.30% intr{irq286: t5nex0:0a2}
   12 root       -92    -     0K  1248K CPU5    5  13:01  97.26% intr{irq288: t5nex0:0a4}
   12 root       -92    -     0K  1248K WAIT    4  12:59  97.19% intr{irq289: t5nex0:0a5}
   12 root       -92    -     0K  1248K CPU2    2  13:17  11.43% intr{irq290: t5nex0:0a6}
   11 root       155 ki31     0K   128K RUN     5  11:02   2.86% idle{idle: cpu5}
   11 root       155 ki31     0K   128K RUN     6  10:58   2.31% idle{idle: cpu6}
   11 root       155 ki31     0K   128K RUN     3  10:52   2.11% idle{idle: cpu3}
   11 root       155 ki31     0K   128K CPU4    4  10:58   2.05% idle{idle: cpu4}
   11 root       155 ki31     0K   128K RUN     7  10:54   1.87% idle{idle: cpu7}
   11 root       155 ki31     0K   128K RUN     0  10:54   1.72% idle{idle: cpu0}
   11 root       155 ki31     0K   128K RUN     1  10:52   1.20% idle{idle: cpu1}
   15 root       -16    -     0K    16K -       7   0:02   0.24% rand_harvestq
    0 root       -92    -     0K   624K -       6   0:01   0.10% kernel{t5nex0 tq1}
   11 root       155 ki31     0K   128K RUN     2  10:44   0.09% idle{idle: cpu2}
 1180 root        20    0 20012K  3876K CPU4    4   0:00   0.06% top
   12 root       -92    -     0K  1248K WAIT    0   0:00   0.04% intr{irq301: t5nex0:1a7}
   12 root       -92    -     0K  1248K WAIT    6   0:00   0.03% intr{irq295: t5nex0:1a1}
   12 root       -92    -     0K  1248K WAIT    4   0:00   0.03% intr{irq300: t5nex0:1a6}
   12 root       -92    -     0K  1248K WAIT    7   0:00   0.03% intr{irq299: t5nex0:1a5}
   12 root       -92    -     0K  1248K WAIT    0   0:00   0.03% intr{irq294: t5nex0:1a0}
   12 root       -60    -     0K  1248K WAIT    1   0:00   0.02% intr{swi4: clock (0)}
   12 root       -92    -     0K  1248K WAIT    4   0:00   0.02% intr{irq296: t5nex0:1a2}
   12 root       -92    -     0K  1248K WAIT    0   0:00   0.02% intr{irq298: t5nex0:1a4}
   12 root       -92    -     0K  1248K WAIT    0   0:00   0.01% intr{irq297: t5nex0:1a3}
 1090 root        20    0 56296K  6384K select  3   0:00   0.00% sshd
   14 root       -68    -     0K   240K -       6   0:00   0.00% usb{usbus2}
   14 root       -68    -     0K   240K -       6   0:00   0.00% usb{usbus2}
   14 root       -68    -     0K   240K -       6   0:00   0.00% usb{usbus0}
   12 root       -88    -     0K  1248K WAIT    6   0:00   0.00% intr{irq20: ehci1}
   12 root       -92    -     0K  1248K WAIT    5   0:00   0.00% intr{irq278: igb1:que 5}
   14 root       -68    -     0K   240K -       6   0:00   0.00% usb{usbus0}
   12 root       -88    -     0K  1248K WAIT    6   0:00   0.00% intr{irq21: ehci0}
   14 root       -68    -     0K   240K -       1   0:00   0.00% usb{usbus1}
   18 root       -16    -     0K    48K psleep  5   0:00   0.00% pagedaemon{pagedaemon}
   24 root        16    -     0K    16K syncer  0   0:00   0.00% syncer
   21 root       -16    -     0K    16K -       5   0:00   0.00% bufspacedaemon
   23 root       -16    -     0K    16K vlruwt  7   0:00   0.00% vnlru
Drivers
Depending on the NIC driver in use, several counters are available:
[root@hp]~# sysctl dev.cxl.0.stats.
dev.cxl.0.stats.rx_ovflow2: 0
dev.cxl.0.stats.rx_ovflow1: 0
dev.cxl.0.stats.rx_ovflow0: 7301719197
dev.cxl.0.stats.rx_ppp7: 0
dev.cxl.0.stats.rx_ppp6: 0
dev.cxl.0.stats.rx_ppp5: 0
dev.cxl.0.stats.rx_ppp4: 0
dev.cxl.0.stats.rx_ppp3: 0
dev.cxl.0.stats.rx_ppp2: 0
dev.cxl.0.stats.rx_ppp1: 0
dev.cxl.0.stats.rx_ppp0: 0
dev.cxl.0.stats.rx_pause: 0
dev.cxl.0.stats.rx_frames_1519_max: 0
dev.cxl.0.stats.rx_frames_1024_1518: 0
dev.cxl.0.stats.rx_frames_512_1023: 0
dev.cxl.0.stats.rx_frames_256_511: 0
dev.cxl.0.stats.rx_frames_128_255: 0
dev.cxl.0.stats.rx_frames_65_127: 0
dev.cxl.0.stats.rx_frames_64: 12522860904
(...)
[root@hp]~# sysctl -d dev.cxl.0.stats.rx_ovflow0
dev.cxl.0.stats.rx_ovflow0: # drops due to buffer-group 0 overflows
Notice the high number of "drops due to buffer-group 0 overflows". This is a global performance problem on this system (in this example, the packet generator is sending the smallest packets at about 14 Mpps).
pmcstat
While the router/firewall is under high load, load the hwpmc(4) module:
kldload hwpmc
Time used by process
You can display the most time-consuming processes with:
- AMD: ls_not_halted_cyc
- Intel: cpu_clk_unhalted.thread_p
- ARM: CPU_CYCLES
pmcstat -TS cpu_clk_unhalted.thread_p -w1
This produces output like:
PMC: [INSTR_RETIRED_ANY] Samples: 56877 (100.0%) , 0 unresolved

%SAMP IMAGE      FUNCTION             CALLERS
  7.2 kernel     bzero                m_pkthdr_init:2.4 ip_findroute:1.8 ip_tryforward:1.6 fib4_lookup_nh_basic:1.3
  6.1 if_cxgbe.k eth_tx               drain_ring
  5.9 kernel     bcopy                eth_tx:2.3 arpresolve:1.9 get_scatter_segment:1.7
  4.5 kernel     atomic_cmpset_long   mp_ring_enqueue:2.5 drain_ring:2.0
  3.7 kernel     __rw_rlock           arpresolve:2.7 fib4_lookup_nh_basic:1.0
  3.4 kernel     rn_match             fib4_lookup_nh_basic
  3.3 kernel     ip_tryforward        ip_input
  3.2 kernel     _rw_runlock_cookie   fib4_lookup_nh_basic:2.2 arpresolve:1.0
  2.9 if_cxgbe.k reclaim_tx_descs     eth_tx
  2.9 if_cxgbe.k service_iq           t4_intr
  2.9 kernel     ether_output         ip_tryforward
  2.8 kernel     ether_nh_input       netisr_dispatch_src
  2.8 if_cxgbe.k cxgbe_transmit       ether_output
  2.8 kernel     netisr_dispatch_src  ether_demux:1.7 ether_input:1.1
  2.7 kernel     uma_zalloc_arg       get_scatter_segment
  2.5 kernel     _rm_rlock            in_localip
  2.4 if_cxgbe.k t4_eth_rx            service_iq
  2.3 if_cxgbe.k parse_pkt            cxgbe_transmit
  2.3 kernel     memcpy               ether_output
  2.2 kernel     uma_zfree_arg        m_freem
  2.1 kernel     spinlock_exit        ether_nh_input
  2.0 kernel     fib4_lookup_nh_basic ip_findroute
  2.0 kernel     ip_input             netisr_dispatch_src
  2.0 if_cxgbe.k get_scatter_segment  service_iq
  1.9 kernel     __mtx_lock_flags     eth_tx
  1.8 kernel     __mtx_unlock_flags   eth_tx
  1.6 kernel     random_harvest_queue ether_nh_input
  1.4 if_cxgbe.k mp_ring_enqueue      cxgbe_transmit
  1.1 kernel     bcmp                 ether_nh_input
  1.1 kernel     critical_enter
  1.1 kernel     key_havesp           ipsec4_capability
  1.0 kernel     m_adj                ether_demux
  1.0 kernel     ipsec4_capability    ip_input
  1.0 kernel     in_localip           ip_tryforward
  0.9 kernel     pmap_kextract        parse_pkt
  0.7 kernel     ether_demux          ether_nh_input
  0.7 kernel     arpresolve           ether_output
  0.7 kernel     _rm_runlock          in_localip
  0.7 kernel     sglist_count         parse_pkt
  0.6 kernel     lock_delay           _mtx_lock_spin_cookie
  0.6 kernel     critical_exit
In this case, the bottleneck is the network stack (most of the time is spent in ip_findroute, called by ip_tryforward).
CPU cycles spent
To see where CPU cycles are being spent, you first need a partition of about 200 MB that includes the debug kernel:
system expand-data-slice
mount /data
Then, under high load, collect samples for about 20 seconds:
pmcstat -z 50 -S cpu_clk_unhalted.thread -l 20 -O /data/pmc.out
pmcstat -R /data/pmc.out -z50 -G /data/pmc.stacks
less /data/pmc.stacks
Lock contention source
To identify the source of lock contention (for example, if lock_delay or __mtx_lock_sleep appears high in the pmcstat output), use lockstat to find which lock is contended and why.
You can generate two outputs:
- Contended locks broken down by type: lockstat -x aggsize=4m sleep 10 > lock-type.txt
- Stacks associated with the lock contention, to identify the source: lockstat -x aggsize=4m -s 10 sleep 10 > lock-stacks.txt